Build a Waterfall Chart That Keeps Starting Value, Changes, and Ending Value Auditable
Use a waterfall chart to explain how a starting balance becomes an ending balance without mixing totals, changes, and sign conventions.
Open Waterfall Chart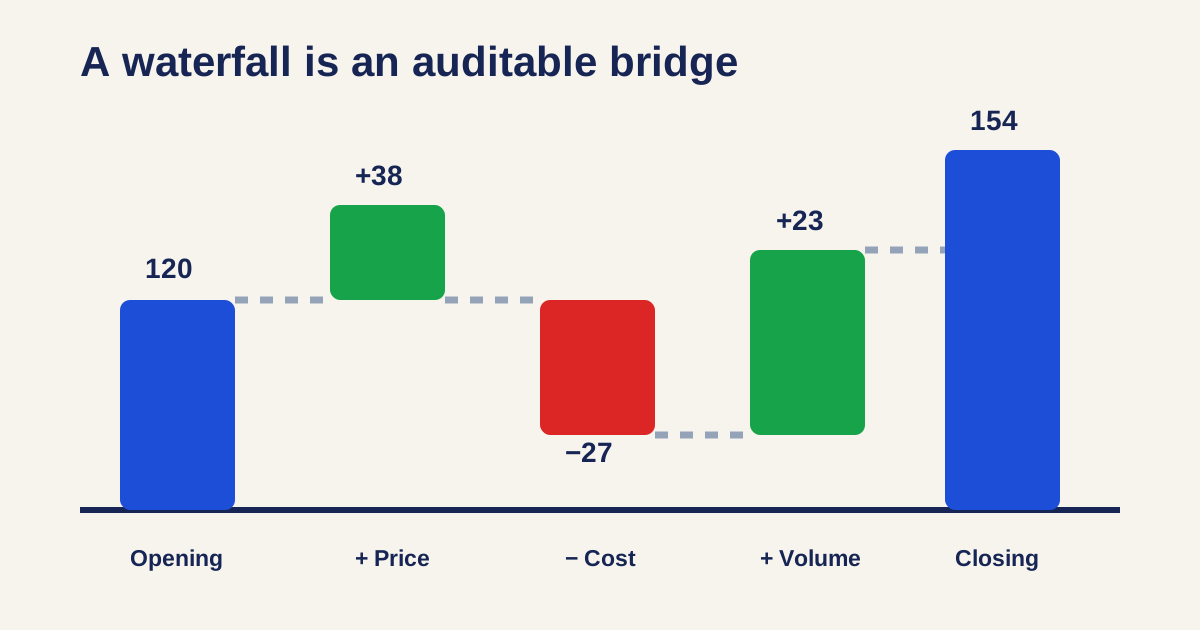
A monthly result moved from 120 to 154, and the team wants to explain why. A waterfall chart is useful only when every floating bar is a signed change against a running balance and the closing total reconciles to the opening total plus those changes.
Model the bridge before styling it
- Set the first and last bars as totals with their actual values.
- Enter each intervening driver as a signed change, not as another total; increases are positive and reductions are negative.
- Choose a consistent order, such as price, volume, costs, and adjustments, and keep that order across reporting periods.
- Check the arithmetic independently: opening value + every change must equal the displayed closing value.
- Label material drivers with values and keep minor drivers grouped only when their grouping rule is explicit.
Avoid a chart that is visually right but mathematically vague
Do not use a waterfall to compare unrelated category totals or to imply a time series when the bars are actually a decomposition. Its technical value comes from the running baseline: each change begins where the previous balance ends. If readers need to compare category magnitudes across several periods, use Bar Chart or Line Chart alongside the bridge.
Related UtilFlow links
Use Waterfall Chart for the opening-to-closing explanation, CSV Chart Maker to check a pasted table before charting, and Bar Chart or Line Chart when the analysis is a direct comparison rather than a reconciliation.
FAQ
What should be a total in a waterfall chart?
The opening and closing balances are normally totals. Add an intermediate total only when it represents a meaningful subtotal that can be reconciled.
Why does my ending bar not match the reported total?
Check sign conventions, omitted adjustments, and whether a row was entered as an absolute total instead of a signed change.
Can a waterfall chart show percentages?
Yes, but all values should share the same basis. Do not mix percentage-point changes, percentages, and currency amounts in one reconciliation.