Clean the CSV Shape Before One Bad Row Becomes a Chart Pattern That Never Happened
Inspect delimiters, headers, missing values, and numeric columns before a CSV chart turns parsing mistakes into visual evidence.
Open CSV Chart Maker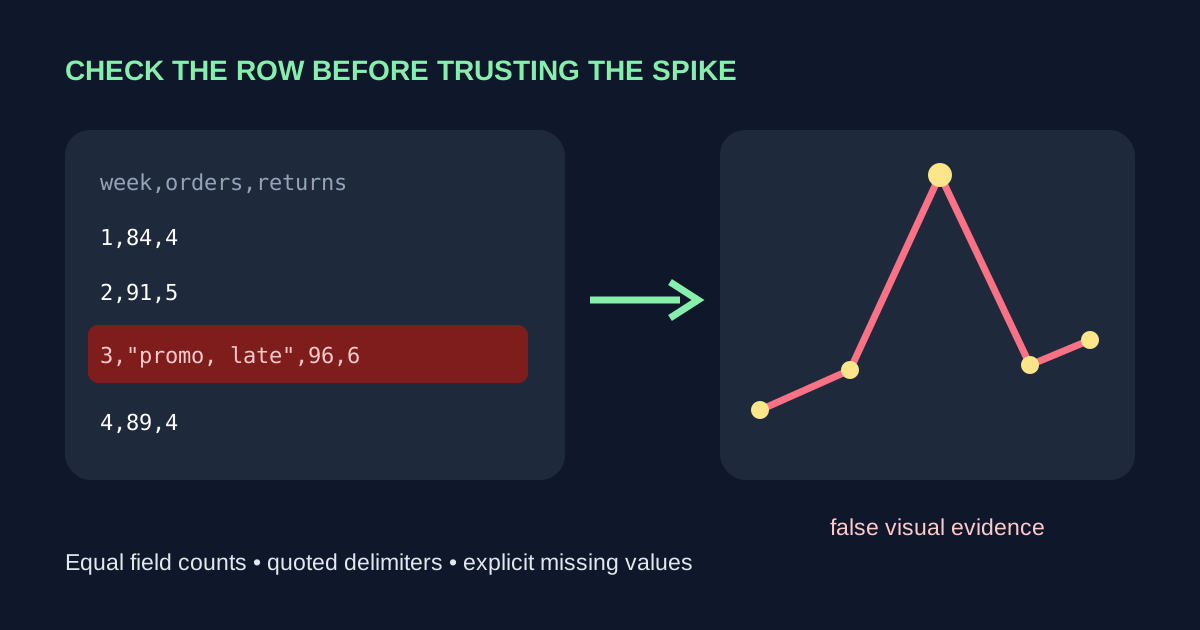
A chart shows a sudden spike, but the source row contains one extra comma inside an unquoted note. Every following value shifts a column, and the chart faithfully visualizes a parsing error.
Validate the table shape before reading the pattern
- Confirm the first row contains the intended labels and every data row has the same number of fields.
- Quote values that contain the delimiter, such as a note with commas.
- Decide whether blanks mean zero, missing, or not applicable before charting.
- Remove totals and footnotes unless they are deliberate series values.
- Paste a small representative sample into CSV Chart and compare plotted points with the source rows.
Choose the chart after the data survives parsing
Use a line for ordered change, bars for discrete comparisons, and scatter points for paired numeric observations. If the chosen visual requires reshaping the same data repeatedly, preserve one clean CSV source and derive views from it instead of editing each chart copy.
Related UtilFlow links
Use CSV Chart for quick visual inspection, CSV JSON Converter when a structured record check is easier in JSON, and Line Chart or Bar Chart when the final message is already clear.
FAQ
Why did my CSV chart shift values into the wrong series?
A row may contain an extra unquoted delimiter or a different field count from the header.
Should a blank CSV cell become zero?
Only when zero is the true observation; otherwise preserve it as missing so the chart does not invent a measurement.
How much data should I test first?
Start with the header plus a few normal, missing, quoted, and boundary rows before loading the full export.