Check the Radius Scale Before a Rose Chart Turns Small Differences Into Large Petals
Diagnose how radius, area, category order, and missing values can make a rose chart overstate or scramble the pattern in cyclic data.
Open Nightingale Rose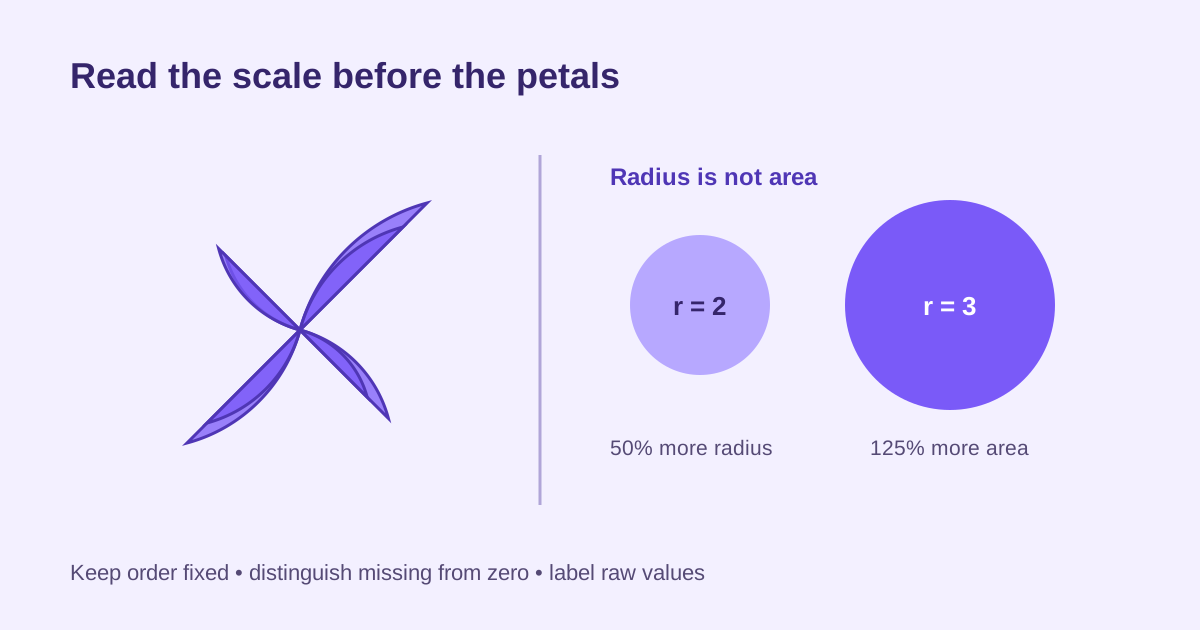
A rose chart uses repeated angular sectors, so viewers often compare the visible petal areas before reading labels. If the encoded value controls radius, area grows with the square of that radius and a modest numeric gap can look much larger than expected.
Four checks before trusting the flower
- Confirm whether the chart maps values to radius or normalizes them to sector area.
- Keep category order fixed when the sequence represents months, compass directions, stages, or another cycle.
- Distinguish zero from missing data; an absent reading is not automatically a zero-length petal.
- Use a bar chart when precise ranking matters more than cyclic pattern, and include the raw values in labels or an adjacent table.
Related UtilFlow links
Use Rose Chart for cyclic category patterns, Bar Chart for precise comparisons, and CSV Chart to inspect whether category labels and values were parsed in the intended order.
FAQ
Is a rose chart the same as a pie chart?
No. Pie charts vary angle to show shares of a whole; rose charts commonly keep angles equal and vary radial extent.
Why can a rose chart exaggerate differences?
If values map directly to radius, the visible sector area grows quadratically, making larger values occupy disproportionately more ink.
When is a bar chart better?
Choose bars when exact comparison and ranking are the main tasks rather than a repeating or directional pattern.