Plot the Raw Pairs Before One Average Hides Two Opposite Groups
Use a Scatter Plot to expose clusters, outliers, and subgroup reversals before a single average or correlation becomes the whole story.
Open Scatter Plot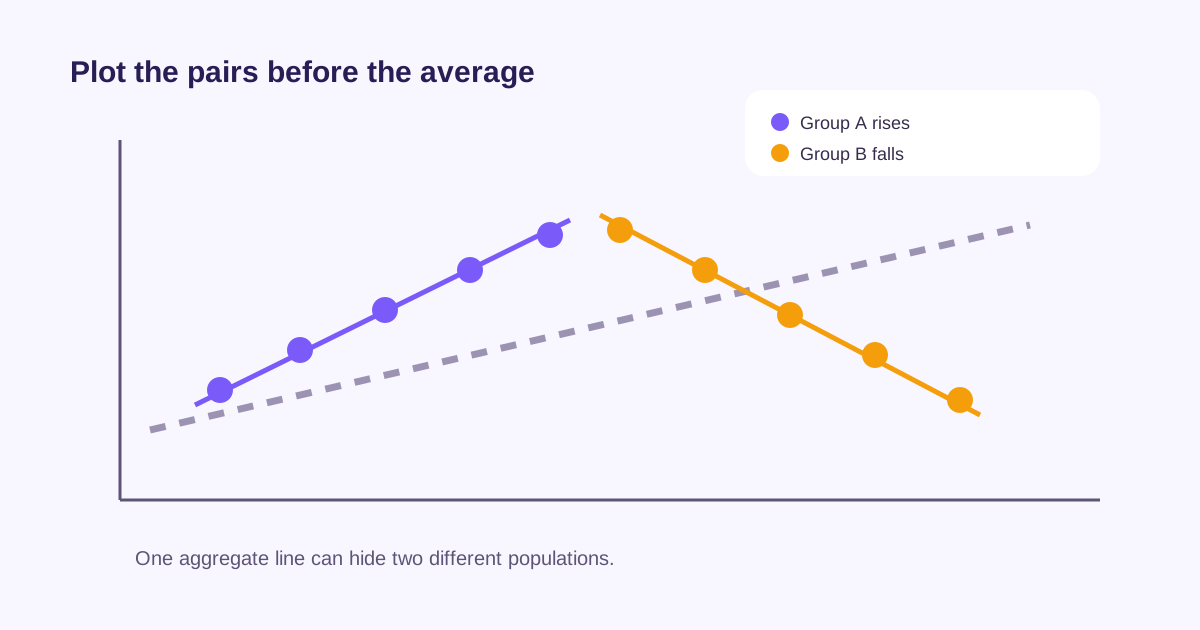
A single mean can flatten a dataset that contains two different populations. An overall trend line can also point in a direction that neither subgroup follows. Before summarizing paired measurements, plot every x-y pair and preserve the grouping field that may explain the shape.
What the aggregate can hide
- Two clusters may represent different devices, regions, cohorts, or measurement conditions.
- One extreme point can pull a trend line without representing the normal process.
- A curved relationship can look weak when only linear correlation is reported.
- Overplotting can hide repeated values, so point size, transparency, or grouped series may need adjustment.
Related UtilFlow links
Use Scatter Plot for paired observations, CSV Chart when the source arrives as a table, and Line Chart only when sequence or time order is part of the question.
FAQ
Does a scatter plot prove causation?
No. It reveals the shape and strength of association, but design, timing, confounders, and domain evidence are still needed for a causal claim.
Should I remove an outlier?
First determine whether it is a data error, a different population, or a valid rare event. Document any exclusion instead of deleting it only to improve the trend.
When should points be grouped by color?
Use groups when a known category could explain clusters or reversals, and keep the legend small enough to read.