Normalize the Radar Chart Scale Before the Largest Spoke Wins by Construction
Prevent mixed units and mismatched ranges from turning a radar chart into a visual ranking of scales instead of performance.
Open Radar Chart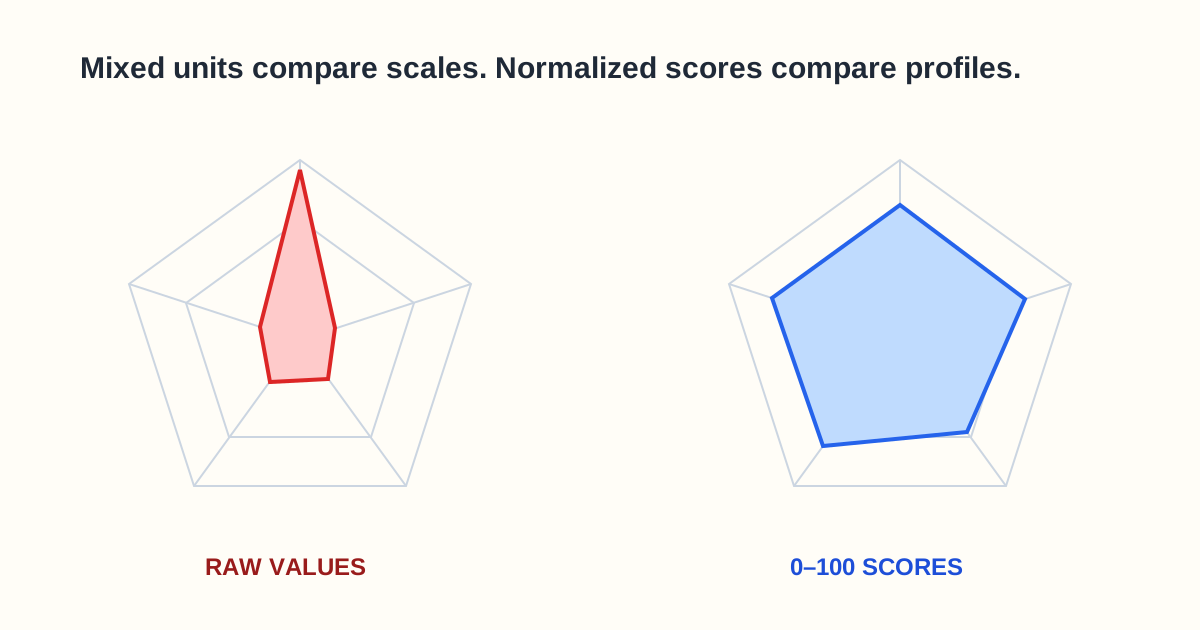
A product comparison uses price in dollars, setup time in minutes, uptime in percent, and a five-point support score. The dollar axis dominates the polygon, but it does not prove that price matters most. It only proves that 2,000 is larger than 99 on a shared numeric radius.
The shape should compare meaning, not raw magnitude
Convert every metric to a common, documented scale such as 0–100. Define the minimum and maximum from a policy, benchmark, or fixed domain rather than silently recalculating them for each comparison. Otherwise the same value moves when a new candidate appears.
Reverse metrics where lower is better
For cost, latency, error rate, or setup time, a larger raw number is usually worse. Reverse the normalized score so outward consistently means better. If some spokes mean better and others mean worse, the polygon becomes impossible to read as one performance profile.
Checks before exporting the chart
- Use the same 0–100 domain for every spoke.
- Document each raw-to-score rule outside the chart.
- Keep outward direction consistently better or consistently worse.
- Limit the number of spokes so labels remain readable.
- Pair the image with the source table because area and shape are not precise values.
FAQ
Can a radar chart use mixed units?
Only after the values are normalized to a common meaningful scale. Plotting raw dollars, minutes, percentages, and ratings together is misleading.
Should each dataset have its own maximum?
No for comparison. Use one fixed rule across datasets so identical raw values receive identical plotted scores.
When should I avoid a radar chart?
Use a table or bar chart when exact ranking matters, when there are many metrics, or when normalization rules would need more explanation than the visual provides.