Remove the Other Slice Before a Pie Chart Hides the Categories That Need Action
Use a Pie Chart problem guide when a large Other segment makes a clean share-of-total graphic less useful for decisions.
Open Pie Chart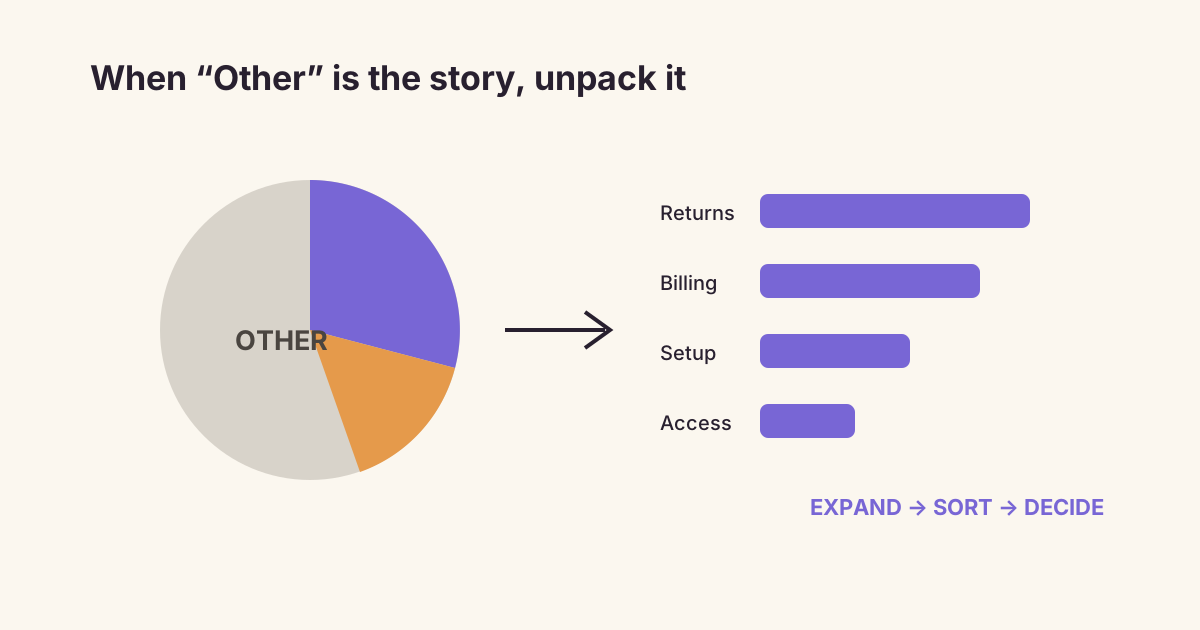
Grouping small categories into Other can make a pie chart tidy, but tidiness is not the same as clarity. If Other becomes one of the largest slices, the chart has hidden the very categories a team may need to investigate, fund, or remove.
Why the chart stops helping
- The total remains correct, but the composition of Other becomes invisible.
- Similar slice angles are hard to rank precisely without direct labels.
- Too many colors turn the legend into a lookup task.
- A large Other slice often signals that the question is category comparison, not simple part-to-whole communication.
Fix the decision before the styling
Keep a pie chart when a few distinct categories explain nearly all of the total. Otherwise expand Other, sort the values, and test a bar chart. Confirm that values share one denominator and that percentages sum to the stated whole before exporting.
Related UtilFlow links
Use Pie Chart for a compact part-to-whole view, Donut Chart when one total belongs in the center, and Bar Chart Maker when precise category comparison matters more.
FAQ
How large can an Other slice be?
There is no universal cutoff, but reconsider the chart whenever Other is large enough to affect the decision or rank among the leading slices.
When is a bar chart clearer?
Use bars when viewers need to rank categories, compare close values, or inspect many components.
Should pie slices be sorted?
A consistent order can help scanning, but preserve a meaningful fixed order when the categories have one.