Hold the Stacked-Bar Total Constant Before Composition Starts Looking Like Growth
Learn when a stacked bar should compare totals, when it should compare shares, and why mixing the two questions creates a persuasive but ambiguous chart.
Open Stacked Bar Chart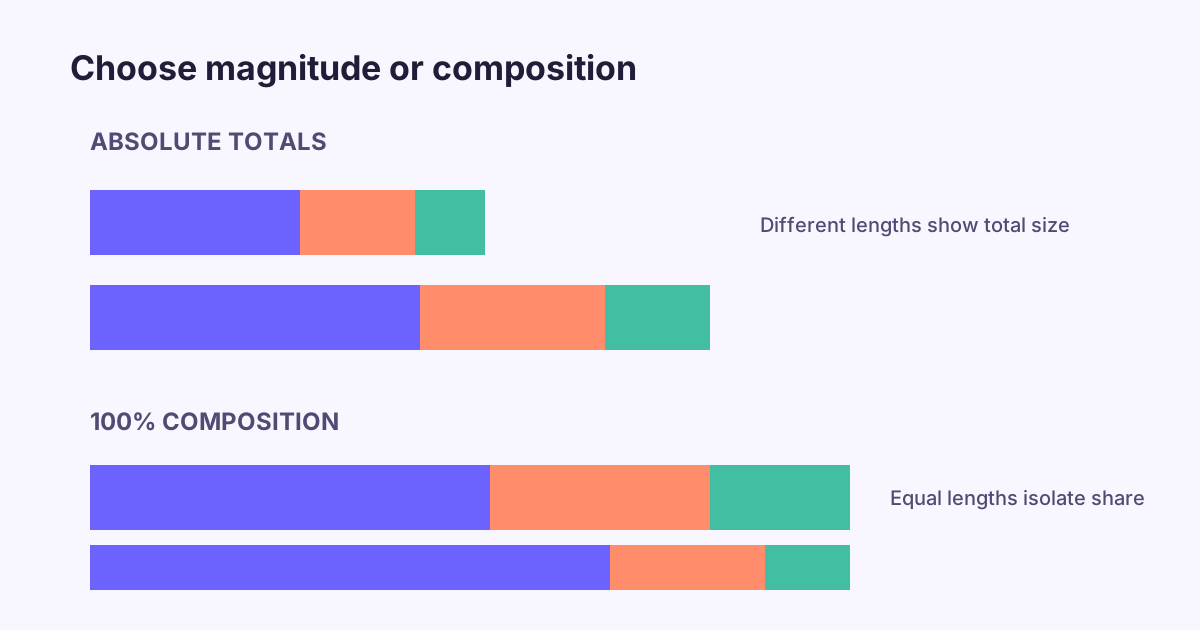
A stacked bar can show two different stories: how large each total is, or how each total is composed. When bar lengths vary, both stories compete. A larger segment may reflect real share growth, a larger overall total, or both.
Choose the question before the chart mode
- Use absolute stacks when the total magnitude matters and every segment uses the same unit.
- Use 100% stacks when the comparison is about share and equal bar lengths make that denominator explicit.
- Keep category order and colors consistent across bars.
- Label totals separately when readers must recover magnitude from a composition chart.
A reliable chart-making workflow
Build the absolute version first in Stacked Bar Chart Maker and verify that each bar total reconciles with the source table. Then decide whether the audience needs magnitude, composition, or two separate views rather than one overloaded chart.
Related UtilFlow links
Use Stacked Bar Chart for part-to-whole comparisons, Bar Chart for direct category ranking, and CSV Chart Maker to inspect pasted rows before choosing a visual form.
FAQ
When should I use a 100% stacked bar chart?
Use it when the main question is how composition differs across groups and the absolute totals are secondary.
Why are middle segments hard to compare?
They do not share a common baseline. Put the most important segment at a consistent edge or use a grouped bar when precise comparison matters.
Can stacked bars mix percentages and counts?
Not safely in one stack. Every segment contributing to a total should use the same unit and denominator.