Separate Total Volume From Category Mix Before a Stacked Bar Chart Tells the Wrong Story
Use Stacked Bar Chart to compare totals and composition without letting one visual imply a category trend it cannot reliably show.
Open Stacked Bar Chart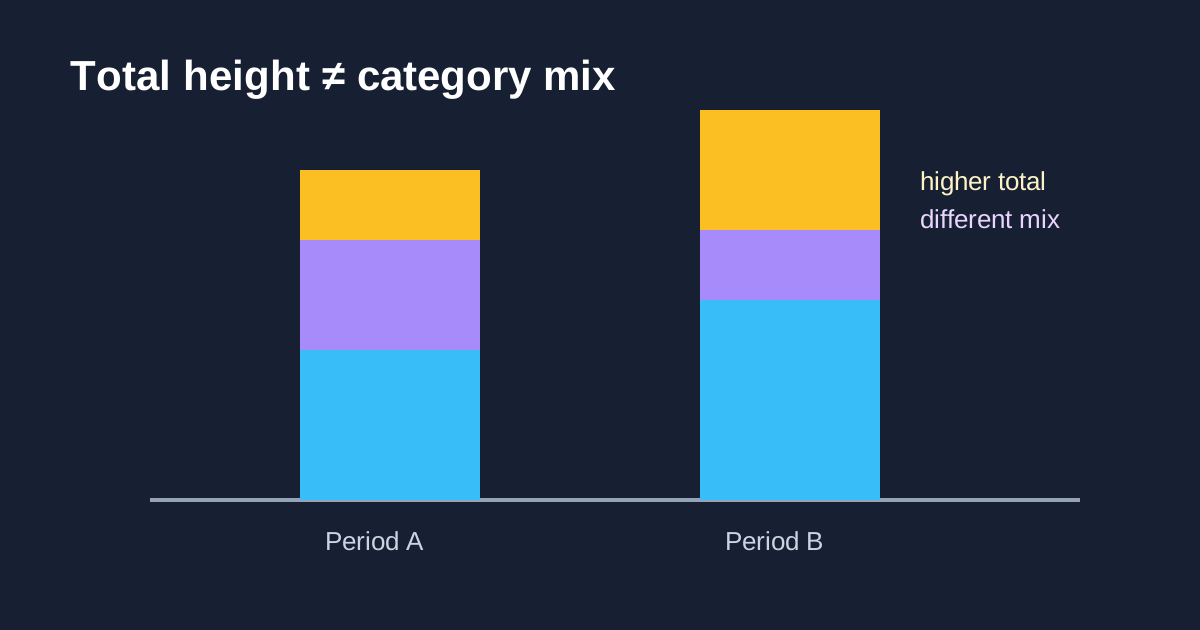
A category segment looks taller this month, but it may have gained share, gained raw volume, or simply risen because the whole total grew. A stacked bar can show useful structure, but only if the question is clear before the chart is read as evidence.
Choose the comparison that answers the question
- Use ordinary stacked bars when both the total and component amounts matter.
- Use a 100% stacked view when composition matters more than the changing total.
- Keep category order and colors stable across every bar.
- Limit segments so labels and thin bands remain readable.
- Show the source totals or a companion table when exact comparisons drive a decision.
Inspect the input before exporting
Check that every period has the same categories, blanks are not silently treated as zeros, and totals are not included again as a separate segment. Then use Stacked Bar Chart to preview the composition. If a reader must compare one category across many periods precisely, a line or grouped-bar view may be more legible.
Related UtilFlow links
Use Stacked Bar Chart for total-plus-mix context, CSV Chart Maker to validate pasted rows, and Line Chart when the category’s time trend—not its share of a total—is the actual question.
FAQ
When should I use a 100% stacked bar?
Use it when each period should be compared as a share of its own total and absolute volume is secondary.
Why are middle segments hard to compare?
They do not share a common baseline, so their vertical positions move with every segment below them. Compare their labeled values or use another chart when precision matters.
Should the total be a segment?
No. The total is the sum represented by the full bar height; adding it as a segment double-counts the data.